Cloud Performance Management
PerfCap has extended its PAWZ Performance and Capacity Management solution to encompass unique challenges of Cloud Computing. This extension is call PAWZCloud.For IT managers who must monitor, optimize, and plan their exploding virtual infrastructure in a cost-effective manner, PerfCap delivers:
At-a-glance view of enterprise-level app service (eg. ERP, CRM, etc.) status and consumed vs available resources
Automated collection, analysis and reporting while dramatically improving IT support staff productivity
Just the information you require, when, where and how you need it
Projection of the future infrastructure performance, capacity and risk
PAWZCloud uniquely offers:
Enterprise-to-host level available vs utilized CPU, memory, storage etc. including past history, near-term and projected behavior
Automated analysis ,advising and modeling of configuration optimization
“What if” modeling, hardware re-provisioning , guest re-provisioning and workload changes and cluster/guest re-configuration, effects of moving applications/VMs between hosts
Smooth scaling from 10s of systems to 10s of thousands of systems
Integrated, multi-platform support allowing analysts to focus on performance issues rather than OS-specific problems
Cloud Performance and Capacity Management Challenges
Visualize performance, capacity and risk status of all distributed application services in a single enterprise-wide view
Go beyond simplistic trending to projections of actual system responsiveness reflecting end-user satisfaction
Do realistic capacity planning with limited business forecasts
A solution that scales from 10s to 10,000s of servers
Key Solution Requirements
Metric – Headroom
Methodology – Risk Analysis
Risk Visualization Format
Status Dashboards
Enterprise-wide rollup status (by service, business, etc.)
Transition Reports
The PerfCap Solution
The Key Metric – Headroom
While most capacity management solutions monitor secondary performance indicators such as CPU utilization, I/O rates, memory dynamics, and storage latency, the PerfCap solution analyzes the primary performance indicator, system responsiveness.
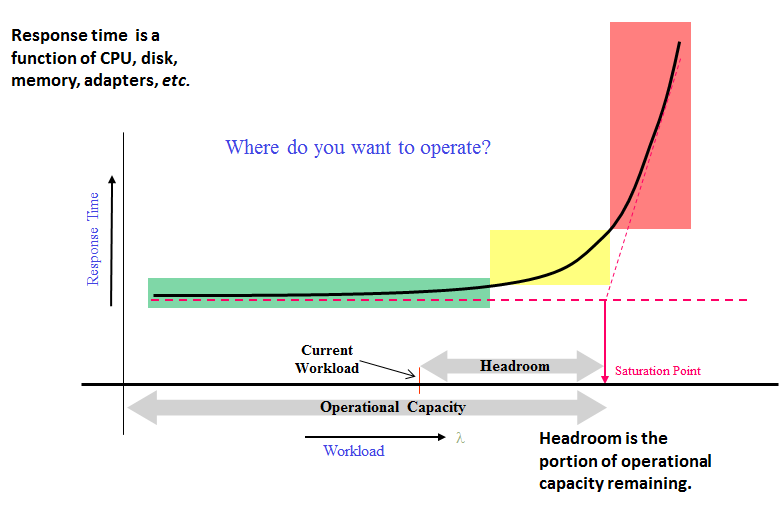
Where do you want to operate? The relationship between level of workload and response time is non-linear. At low levels workload may increase with little corresponding increase in response time (green). At high workload levels (red) response time degrades rapidly (red). Performance beyond the “knee” of the curve (amber) is unacceptable.
The operational capacity of the application is defined as the level of workload up to the “knee” of the curve.
Headroom is the percentage of unused operational capacity remaining at your current workload.
Optimal operation maximizes workload while remaining to the left of the response time curve “knee”. Headroom indicates how close you are that “knee”.
A New Methodology – Headroom Risk Analysis
Risk analysis reduces the likelihood of a server exhausting its capacity headroom to one of three risk colors.
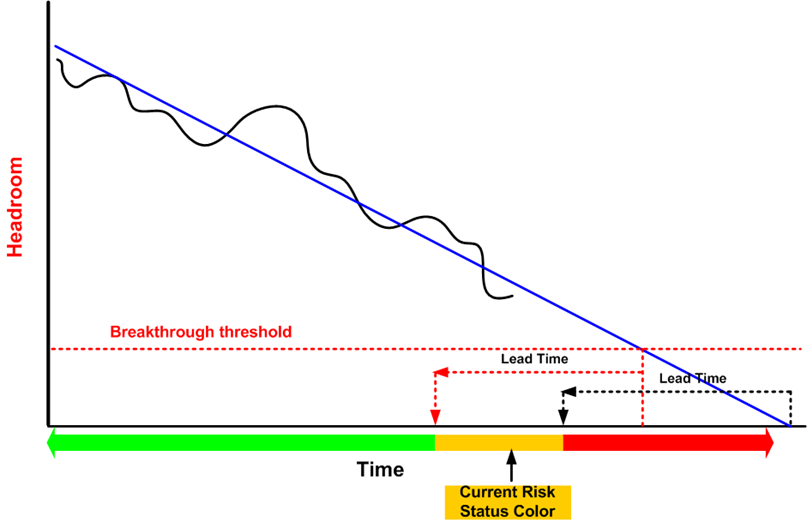
Repeatedly viewing headroom trends for many systems is a laborious and unnecessary task. What is really needed is a simple indicator of when a system will be at risk of exhausting its’ remaining headroom. That indicator is a headroom risk tolerance.
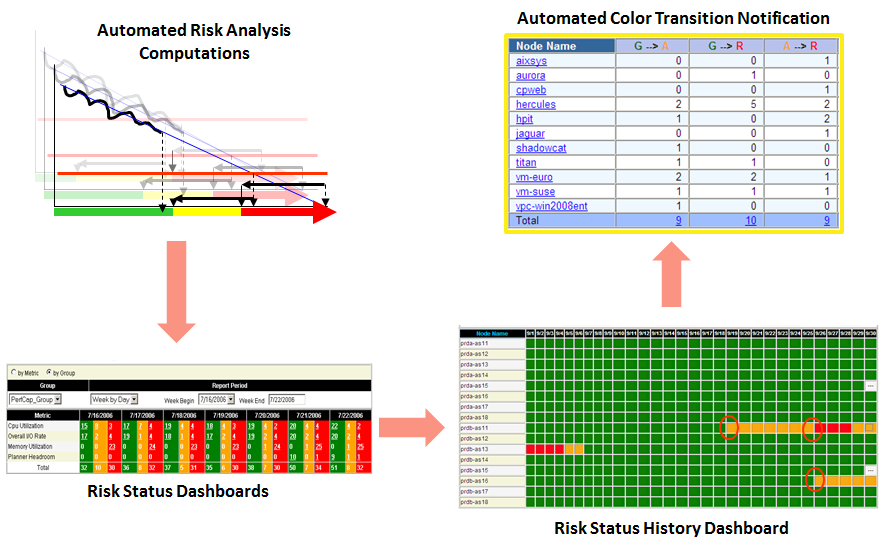
Each day, the PAWZ Server assigns to each system, one of three headroom risk colors, green, amber, or red.
A risk status color of red means that the system is likely to exhaust its headroom within the defined lead time.
A risk status of amber means that, while the system is not likely to exhaust its headroom within the lead time, it is likely to drop below a defined breakthrough threshold headroom level.
A risk status of green means that the system is not likely to exhaust headroom or drop below the threshold within the lead time.
Lead time is configurable and is defined in light of amount of time an organization will require to mitigate the projected headroom exhaustion.
Risk Visualization
The daily headroom risk color computations are displayed in weekly and monthly dashboards. However, when dealing with a large server estate, it is difficult to review many headroom risk status dashboards. A capacity management organization needs be notified only when there is a headroom risk color transition. This transition is the trigger for investigation and change management.
Product Trial
Download a full featured trial of:
PAWZ with PAWZCloud
FindIT
PAWZCloud *NEW*
Agent-less data collection: Uses VMware VI API
Enterprise, Datacenter, Cluster and Host views
Multi-level view of Guest and Service provisioning
Long term resource usage projections
Detect Over and Under provisioned guests
Guest provisioning problem identification, analysis and advice


